
Watch The Full Video Covering This Blog
Introduction
Have you just started building a Power BI Dataset and your initial tasks are importing, cleansing, shaping, transforming and preparing the data for Data Modelling? Here are 5 best tips for data transformation, that you can use as a checklist to make sure you don’t miss any critical step while working on day to day development projects.
- Data Transformation As Upstream As Possible
- Shred Data Vertically And Horizontally
- Query Folding Is Your Hidden Friend
- Data Cleansing and Massaging
- Data Shaping
1. Data Transformation As Upstream As Possible
“Apply data transformations as upstream as possible and as downstream as necessary“
In The Data Source
Before even thinking about types and methods of transformations, you should have a strategy where you need to apply the transformation on the data lineage. For instance, you want to import data from an SQL Database into a Power BI model, one of the tables has following three columns: First Name, Middle Name and Last Name, you are only interested in a Full Name (Which will be a concatenation of all of the three columns). It is best to create a concatenated custom column in a view in the SQL DB and then load that into Power BI.
In Power Query
Suppose for some reason, few complex transformations are not handled in the data source, the second best place for that to happen is in the Power Query Editor. Power Query Editor lets you mashup different data sources or tables and offers wide range of transformation options, such as, applying filters, removing duplicates, handling nulls and garbage values, merging and appending multiple tables and many many more. Since, the source data gets filtered and transformed in this stage, before loading into the Power BI Model, the size of the data model becomes reasonable and good quality data will result in high performing model.
In Data Model
You should only perform any transformation at this stage if the requirement is to have dynamic results based on different report contexts. You will be using DAX to define measures, calculated tables and calculated columns. To illustrates, let say we are importing two tables; [Sales] and [Revenue], with different granularity, ‘Daily’ and ‘Monthly’ respectively. We want to maintain original granularity in both the tables, but, let end user select using the report slicers, what granularity they want to see. They may choose to compare Sales with Revenue at quarterly level, in which case, both the tables will be rolled up using DAX aggregation. Alternatively, the user can choose weekly, in which case, Sales will be rolled up using DAX aggregation, whereas, monthly Revenue will be sliced into weekly proportions. All of this can be achieved by creating calculated tables using DAX.
2. Shred Data Vertically And Horizontally
“Only retrieve columns and rows you actually need“
Horizontally: Only Import Absolutely Required Columns
This should be the first item on your checklist, the data source tables may contain hundreds of columns, most probably all of which are not relevant for your data analytics solution. You should exclude unnecessary columns by using either “Choose Columns” or “Remove Columns”, see below image.
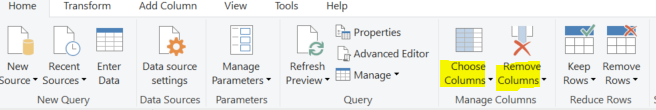
It’s highly recommended to go with “Choose Columns” and select only the required columns, the benefit of this approach over another is that, if in future the data source table exposes additional columns, they won’t flow into the Power BI model. This way, you will have full control of what is getting loaded, hence, reduces maintenance.
Vertically: Reduce Volume Of The Data To Be Imported
It is extremely important to only import data which is relevant to the task on hand. For instance, the data source may contain data for last 20 years but the business expectation from the Power BI model is to show trends for recent years only, in which case you should only import 3-5 years of historical data into the model.
There are two ways you can reduce the data volume:
- Apply filters in the Power Query and get rid of unnecessary data, this could mean only selecting 3 years of data from 20 years of source data, or, importing only North America region’s data from a worldwide central Data Warehouse. As a best practice, you should parametrize these filters, which gives an advantage of having dynamic filter settings and a central place to adjust all the filters at once. Additionally, you get the flexibility to adjust these filters for a published data model in Power BI Service. For instance, during the development stage, you can import only TOP 100 records of all the fact tables by applying parametrized TOP N filter, which can boost development time by making refreshes in Power BI Desktop quicker and consuming computer RAM lesser. When you publish this dataset to the Power BI Service, there you can set the TOP N parameter to 1,000,000,000 depending on the requirement and hit the refresh button, which will run efficiently in the cloud with abundant resources.

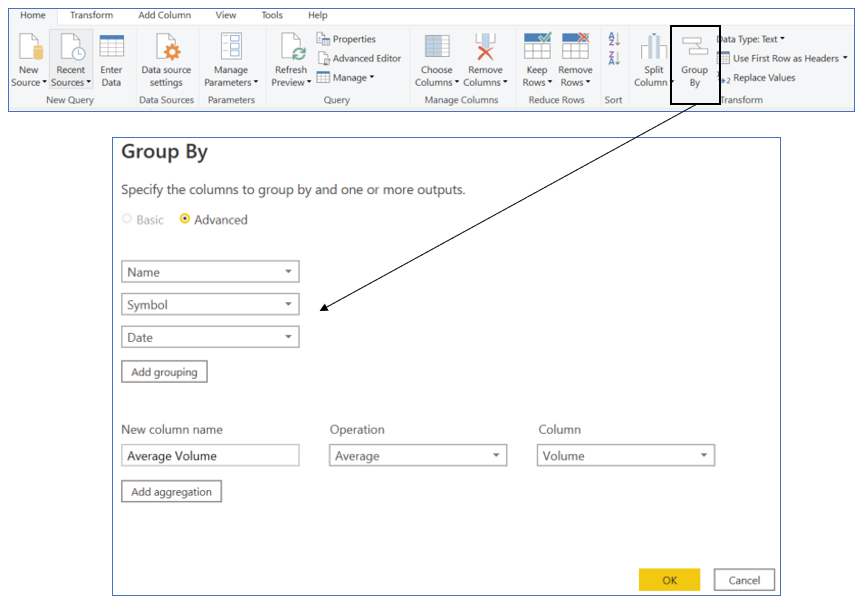
- Reduce granularity by applying Group By on the records, this will result in roll up of the tables with aggregated facts. For instance, you are importing [Sales] table with time granularity at ‘Seconds’ level and you are required to build a model with ‘Daily’ granularity, in this case, we can apply Group By ‘Date’. There are 86,400 seconds in a day, theoretically, with just one rollup from seconds to daily granularity can result in 1 row in Power BI model v/s 86,400 rows in data source.
3. Query Folding Is Your Hidden Friend
“Make sure to first apply transformations which can be Query Folded“
Power Query Mashup Engine can combine and convert transformation steps into data source native queries, send it to the data source server and execute it there, finally bring the transformed output into Power Query Mashup. For instance, if you have SQL Database as a data source, Query Folding can convert your Power Query steps into T-SQL queries and run on the SQL Server and retrieve the outcome.
This great optimization technique in Power Query comes as default, which means, it will try to do Query Folding wherever and whenever is possible. It works well in almost all the queries which can be converted to SELECT statements in relational data sources supporting basic querying language, refer following links to learn more on which queries can be folded or can’t be folded.
As a best practice, make sure to first apply transformations which can be Query Folded and native data sources can run them.
4. Data Cleansing and Massaging
“Dirty data in, dirty analytics out“
CLICK HERE TO LEARN MORE ABOUT DATA CLEANSING RULES YOU MUST NOT SKIP
Traditional data sources such as, SQL Server Warehouse or raw file feeds, tend to contain dirty data, which is often in a raw form and needs cleansing and massaging. In this stage, you need to check the health and state of data to transform it into a useful clean output to be stored in the model.
You can check health of the columns manually or use Power Query Editor’s two out-of-the-box features; ‘Column Quality‘ and ‘Column Profile‘

Once you have done initial data quality check, your next step is to plan a series of transformations. This step can be overwhelming as Power Query Engine offers over 400 transformation tools, however, if you have a clear agenda, it’s not hard to find the right button on the GUI.
Refer below some useful transformations that are often required during any type of data import:
Data Type Corrections
Power Query Engine is smart enough to detect data type of all the incoming columns, however, the default data type might not be adequate for the task on hand. For examples, a ‘Date/Time’ column with granularity to milliseconds should manually be converted into ‘Date’, if only the date part is relevant. Similarly, all the KEY columns required for relationships, should be of type ‘Whole Number’ (64 bit Integer) for best model performance. Refer this to learn more about Power BI Desktop data types.
Remove Duplicates
Duplicate records can cause following issues:
- Consume additional storage in the model and can mess up DAX aggregations.
- When you join tables with duplicate records, the result merger can produce unexpected results.
- Duplicate records can cause nasty scenarios of Many to Many relationships in the model.
- Can result in inefficient storage compression by the VertiPaq Storage Engine.
You can either remove duplicates at the table level or at the column level.
Handle Errors or Nulls
You can choose to either remove/filter-out records with ERRORS/NULLS or replace them with a meaningful value, such as, average of the column, min/max values in the column or a hard coded default value.
Round up
The decimal values can be rounded to 2 or even zero, if the resulting data analytics solutions will have context of aggregations and high level visualization of data
Rename Tables and Columns
The data sources, such as, SQL Server DB, often have long technical naming standards for schemas, tables and columns. Such nomenclature is useful for developers and admins, but, makes very little sense to the non-technical users of the Power BI data model, who will be consuming it as a Self-Service BI solution. Hence, you should always simplify names of the tables, here is an example of SQL Server table named ‘[FinanceDatabase.dbo.DM_Consumption_Revenue_Fact]’, which can be simply renamed to ‘[Revenue]’ in Power Query. Same logic applies to column names.
5. Data Shaping
“Shape the raw data to suit your data model“
CLICK HERE TO LEARN MORE ABOUT TOP 5 DATA SHAPING RULES
Data sources contain generic data structures, which can serve wide range of requirements from various applications. You need to tailor the data according to your requirement, following tasks maybe required to reach perfect shaped tables for high performing data model:
- Pivot/Unpivot of one or more columns
- Data must grow vertically, not horizontally
- Custom or derived columns
- Conversion of table/column to a LIST
- Merge (Join) or Append (Union) of two or more tables
- Group By to rollup granularity of tables
Conclusion
A good data lineage solution implements all required data transformations as upstream as possible and as downstream as necessary, this dictates which transformation will happen in which stage of data lineage. Before importing data into Power BI make sure you shred data vertically and horizontally, to only load just enough rows and columns required for the data model you are envisioning. Leverage Query Folding feature of Power Query engine, to offload heavy transformation jobs to the data source. Data cleansing and massaging techniques result in high quality trustworthy data, based on which you can build meaningful insights for the business. The raw form of data needs to be shaped into purposeful schema to build a high performing data model.
Watch Full Video Covering This Blog
Next Reads
CLICK HERE TO LEARN MORE ABOUT DATA CLEANSING RULES YOU MUST NOT SKIP
CLICK HERE TO LEARN MORE ABOUT TOP 5 DATA SHAPING RULES

Data evangelist with 11+ years of experience of serving a range of industries and clients worldwide using full stack BI. Here to talk everything data!

