
Summary
“Shape the raw data to suit your data model, make it your own“
Data shaping is a process of transforming schema and format of data, it is a set of data transformations applied in a defined sequence to result in the desired data shape.
Why it is important?
Data sources contain generic data structures, which can serve wide range of requirements in various applications. You need to tailor the data according to your requirement. For instance, your data source is going to feed you with a CSV every week, with weekly data represented in columns, which means, one new column is added every week. This schema won’t work for your data model, as it would require fixed number of columns to perform efficient analysis, hence, data shaping transformation such as ‘UnPivot’ must be applied here.
Which stage it is performed in?
After you have connected Power BI to a data source and performed data cleansing (Check my other blog on 6 rules of data cleansing you must not skip) in the data preview, next step is to perform data shaping transformations, before you load data into model.
What are the general data shaping rules?
There are around 400 data transformation functions available out of the box in Power Query Editor, you can even extend to advanced custom transformations using R and Python scripts. This powerful tool can overwhelm you at first glance and there is a high probability that you miss some important steps even after implementing transformations repeatedly over multiple projects.
I have been there and struggled to do the right thing at the right time in every project, to result in a perfect data model. Hence, I have created my own data shaping checklist of rules, which boosted productivity and accuracy both for me and my team.
Here, is a quick glance of the 5 rules:
- Slim Long Tables
- Add All Possible Columns In Power Query
- Merge Or Append Tables
- Granularity Rollup
- Split/Combine Columns
Detailed Explanation
Let’s look into each rule in depth with examples.
1. Slim Long Tables
“Data must grow vertically, not horizontally“
Try to imagine a table in a relational database or a tabular model, which contains inconsistent column count, which increases every week you query it. Will you be able to query it efficiently in an automated manner and account for all the inconsistencies but yet result in consistent output? No.
Also, think about how Power BI’s VertiPaq storage engine processes data. It does an amazing job in terms of compression and storage when the tables have least number of columns and grow horizontally in rows. Fat tables with lot of unnecessary columns can increase size of the data model, which will take additional space in the cloud.
Let’s look into this simple example, clearly, this schema will result in addition of a new column every week to store future weekly data.

To transform this into a thin table with least number of columns and let the volume of data to grow vertically by adding new rows every week, we will use ‘Unpivot’ function.
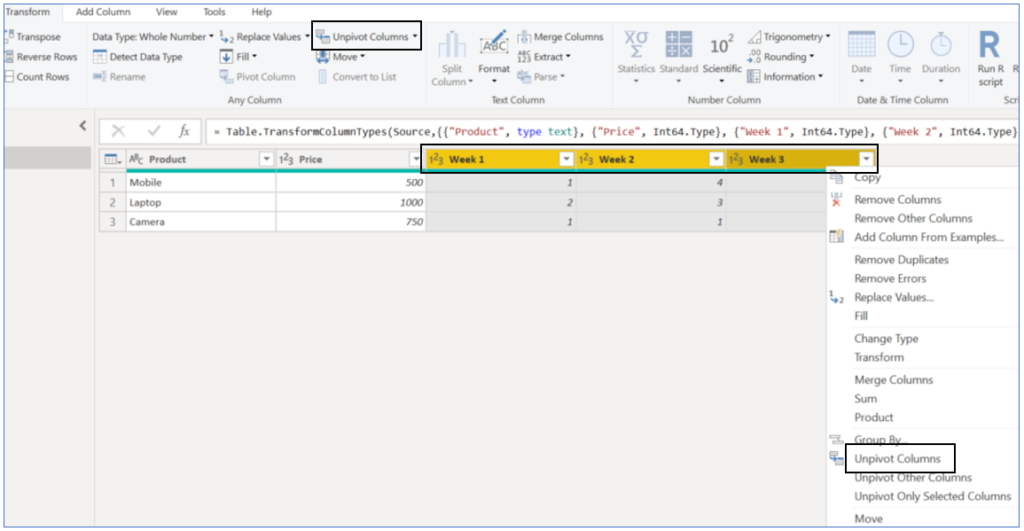
How to? Select all the columns you want to convert into rows, now, select ‘Unpivot columns’ either by right-clicking on the column headers or selecting it in the top ‘Transform’ ribbon:
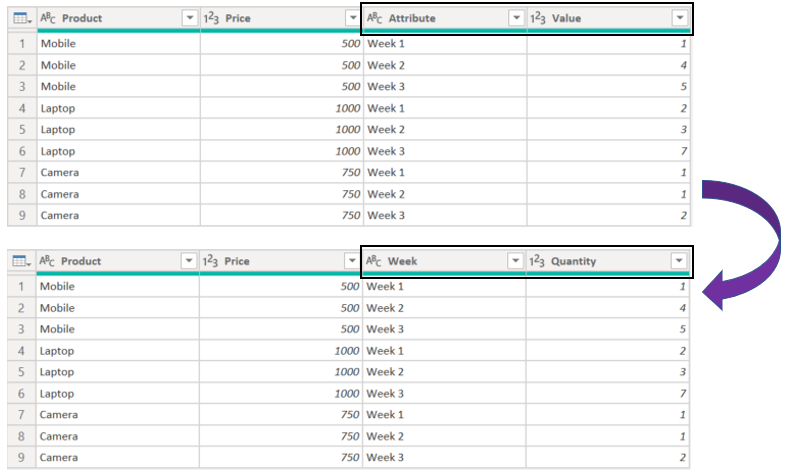
We will get below result, which is exactly what we wanted, we just need to rename auto-generated columns; ‘Attribute’ and ‘Value’, to meaningful names:
2. Add All Possible Columns In Power Query
Whether, you are creating a custom, conditional, index or function column, the aim should be to create all the additional columns in the data shaping stage using Power Query Editor. You should avoid creating calculated tables and columns in the Data Modelling stage using DAX, if no dynamic reporting context is applicable to those columns and they can exist as static.
Let’s use the thin table we created in the previous section and add a new custom column called ‘Sales’.
When the data is in good shape, we can perform additional transformations as per the requirement. In the below example, we can clearly see that adding a new custom column is straightforward using the new thin table schema.

3. Merge Or Append Tables
Very often we are presented with scenarios, where we have to combine data from multiple tables. We should analyse the existing tables thoroughly and determine if we need to combine them or not. If yes, data shaping is the stage you should apply this transformation, as, it will result in a final combined table to feed into the model.
There are two methods of combining multiple tables:
- Merge Queries
- Append Queries
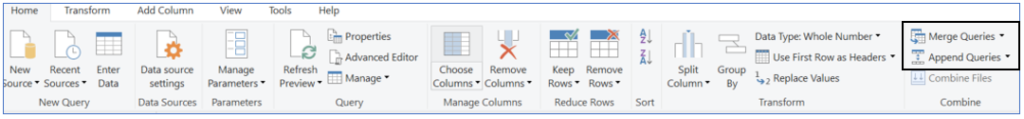
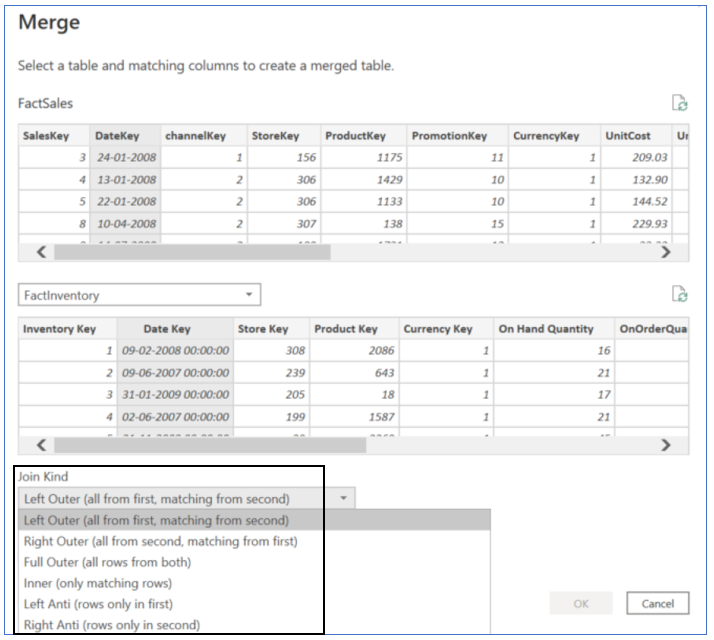
Merge Queries function applies a Join between two tables in a single step, if we need to join more than two tables then we have to apply additional Merge Query steps to join result of previous step with the additional table.
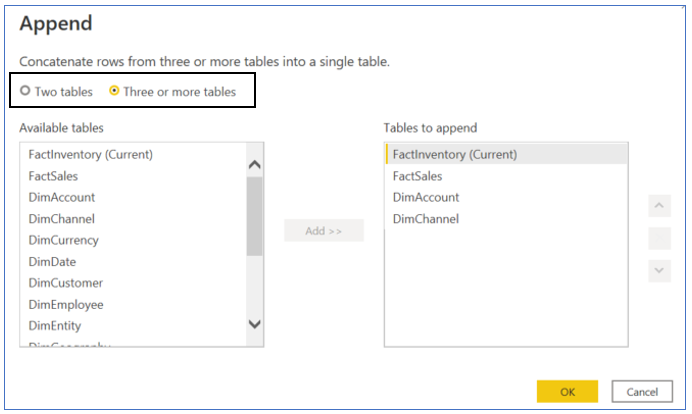
Append Queries applies a Union between multiple tables in a single step:
4. Granularity Rollup
Most often the data source for Power BI is a warehouse, which can store historical data with fine granularity. This level of granularity might not be useful for us, so we must always analyse the existing tables against our envisioned data model’s end result.
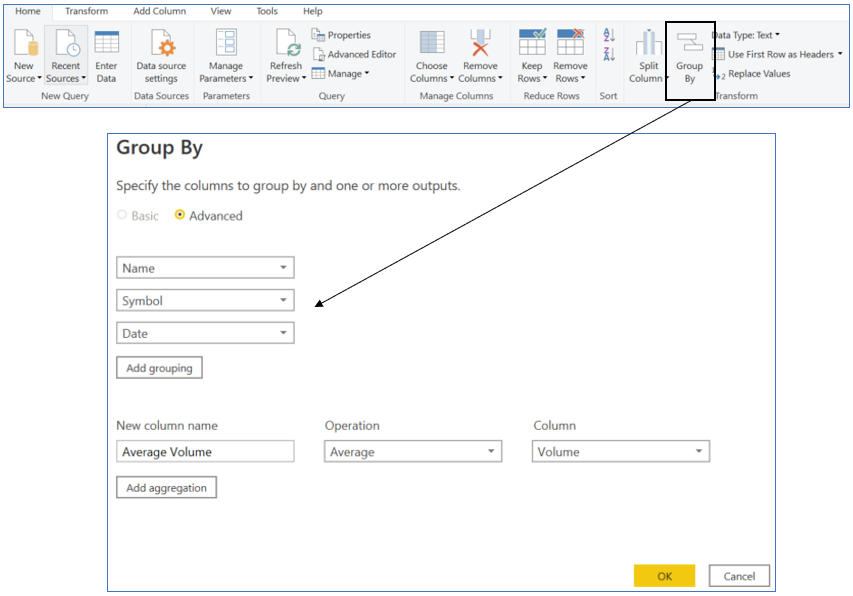
Reduce granularity by applying Group By on rows, this will result in roll up of the table with aggregated facts. For instance, say we are importing [Sales] table with time granularity at ‘Seconds’ level and we are required to build a model with ‘Daily’ granularity, in this case, we can apply Group By ‘Date’. There are 86,400 seconds in a day, theoretically, with just one rollup from seconds to daily granularity can result in 1 row in Power BI model v/s 86,400 rows in data source.
5. Split/Combine Columns
Last but not the least, this rule says, any activity on columns, such as, splitting or combining, must be performed in the data shaping stage.
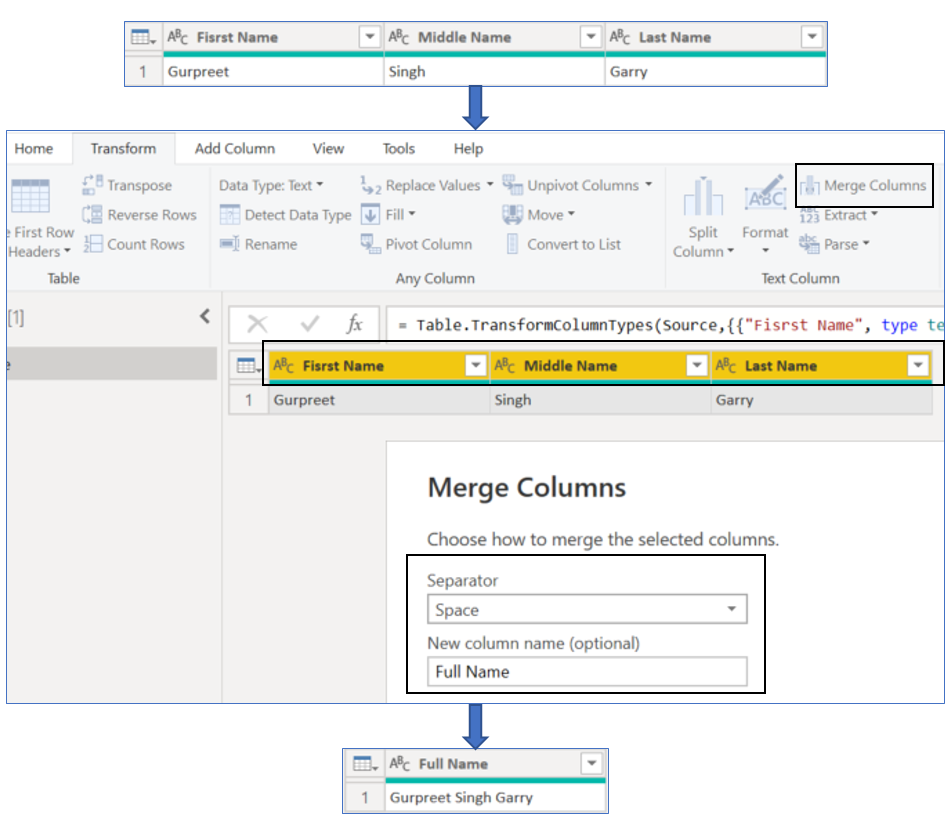
For instance, we need to import data from a SQL Database into a Power BI model, one of the tables has following three columns: ‘First Name’, ‘Middle Name’ and ‘Last Name’, but, we are only interested in the ‘Full Name’ (Which will be a concatenation of all of the three columns). In this case, we have to concatenate the three columns and create a new one to contain the full name.
How to? Select all the columns to be concatenated, click on the ‘Merge Columns’ button in the ‘Transform’ ribbon, select a desired Separator and give a name to the new column:
Conclusion
To sum up, data shaping is a crucial process of transforming a not so good shaped data into a desired shaped data, which will result in a robust data model.
CLICK HERE TO LEARN ABOUT DATA CLEANSING RULES YOU MUST NOT SKIP
CLICK HERE TO LEARN 5 BEST TIPS FOR DATA TRANSFORMATION IN POWER BI

Data evangelist with 11+ years of experience of serving a range of industries and clients worldwide using full stack BI. Here to talk everything data!


Thanks for your blog, nice to read. Do not stop.