Summary
DAX measures in Power BI play crucial role by offering aggregation and calculations on top of facts, that can be visualized and sliced by dimensional fields.
Problem: The list of measures can grow rapidly and become cumbersome to organize, maintain and discover. Specially in a self serve model, analysts can get confused and overlook some important measures.
Solution: Create a MEASURES TABLE to contain all the measures from all the fact tables, organized in folders and sub folders.
Solution
Scenario
Let’s consider below example, where we have 4 dimension and 2 fact tables:
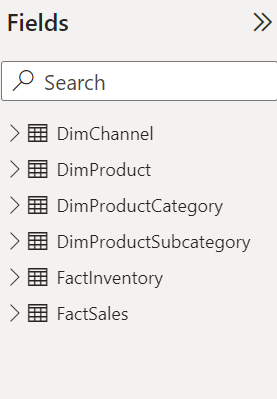
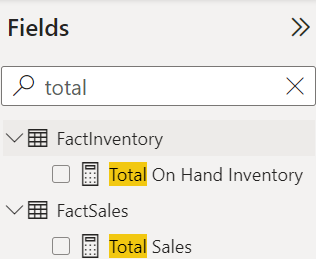
Both fact tables contain measures, we want to move these measures out of the respective fact tables into a new Measures table:
Seven Easy Steps
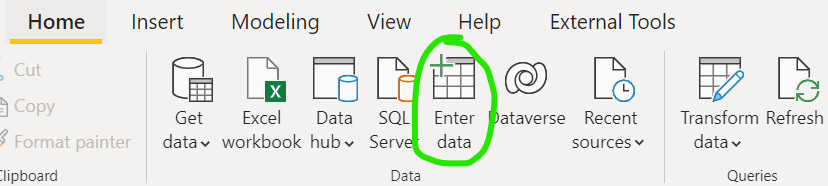
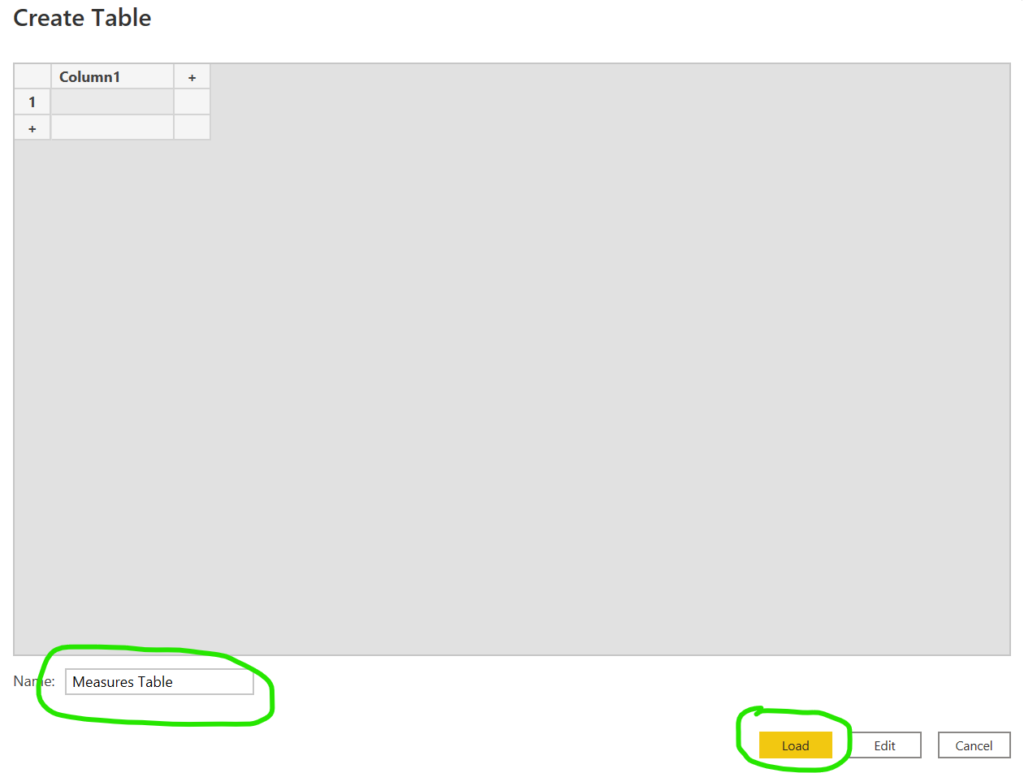
Step 1: Click on ‘Enter Data’ in the top ribbon ‘Home’ menu:
Step 2: Give a desired name to the table and click ‘Load’, no need to edit column header or add value:
Step 3: Go to ‘Modelling’ tab and select the measure in the ‘Fields’ pane. Select ‘Measures Table’ in the ‘Home table’ drop down in ‘Properties’ pane.
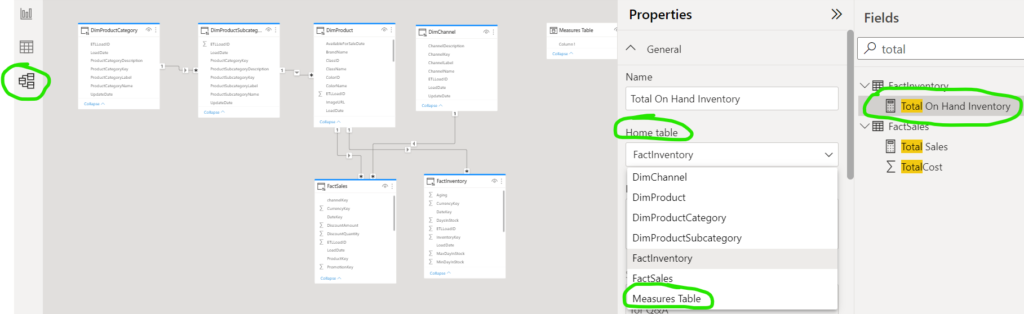
This will move the measure into ‘Measures Table’, repeat this step for all other measures. You can also hold control key and multi select for bulk action.
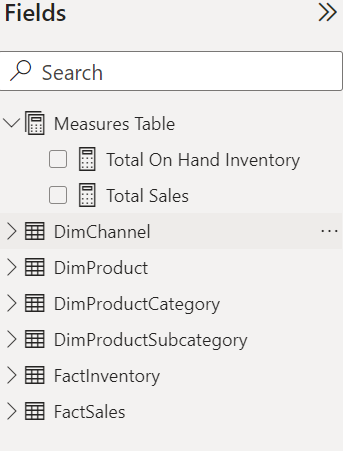
Step 4: Open the ‘Measures Table’ in the ‘Fields’ pane and review if all the required measures are now present in the measure table or not. Now, just remove the dummy column ‘Colimn1’ by right clicking on the field. Before removing, just observe the Measures Table icon, because it’s going to change right after this step.

Step 5: Observe the new icon of Measures Table, which is an indication that the table contains only measures:
Step 6: Since the new Measures Table will contain measures from various fact tables, it’s best to organize them in folders and sub folders. To do this, just go to the ‘Data Modelling’ tab and select the measure (Or hold control key to multi select measures) in the ‘Fields’ pane, enter a title in ‘Display folder’ field:
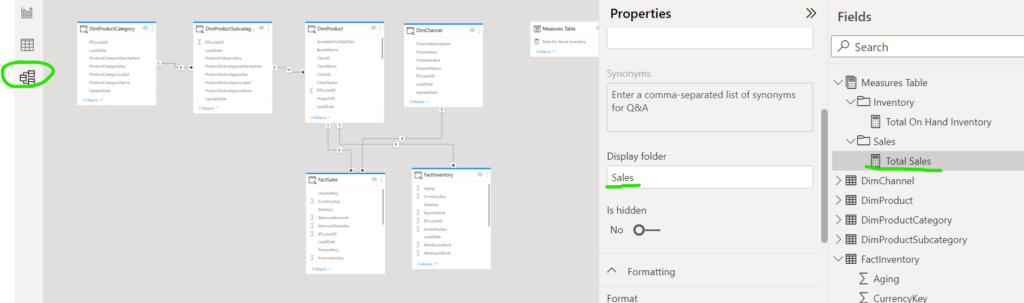
Step 7: Hide the Fact tables and offer a clean view to the model consumers:

Conclusion
To recapitulate, use ‘Measures Table’ to contain all the measures from all the fact tables, organize in folders and subfolders, hide all the fact tables and offer a clean & abstract view to the model consumers. Such view facilitates better measure discovery and makes maintenance easy.
Found this useful? Let me know your thoughts in the comments below.

Data evangelist with 11+ years of experience of serving a range of industries and clients worldwide using full stack BI. Here to talk everything data!